
= Jayden Ziegler


Run run run
As some of you know, I’m OBSESSED with running.
In fact, I haven’t missed a single day of running since 1/1/2016.
That’s XXX consecutive days!!
I’m also obsessed with data.
So I wondered what all that data would look like. These plots span 11/25/2011 (the first run I tracked with GPS) to today. They're of course downsampled AF (though still huge, relatively), otherwise they'd break your browser:
Jayden Runs SF [Heatmap]
Jayden Runs Boston [Heatmap]
Jayden Runs NYC [Heatmap]
Jayden Runs Everywhere Else [Heatmap]
And for summary: Oh, The Places I’ve Run
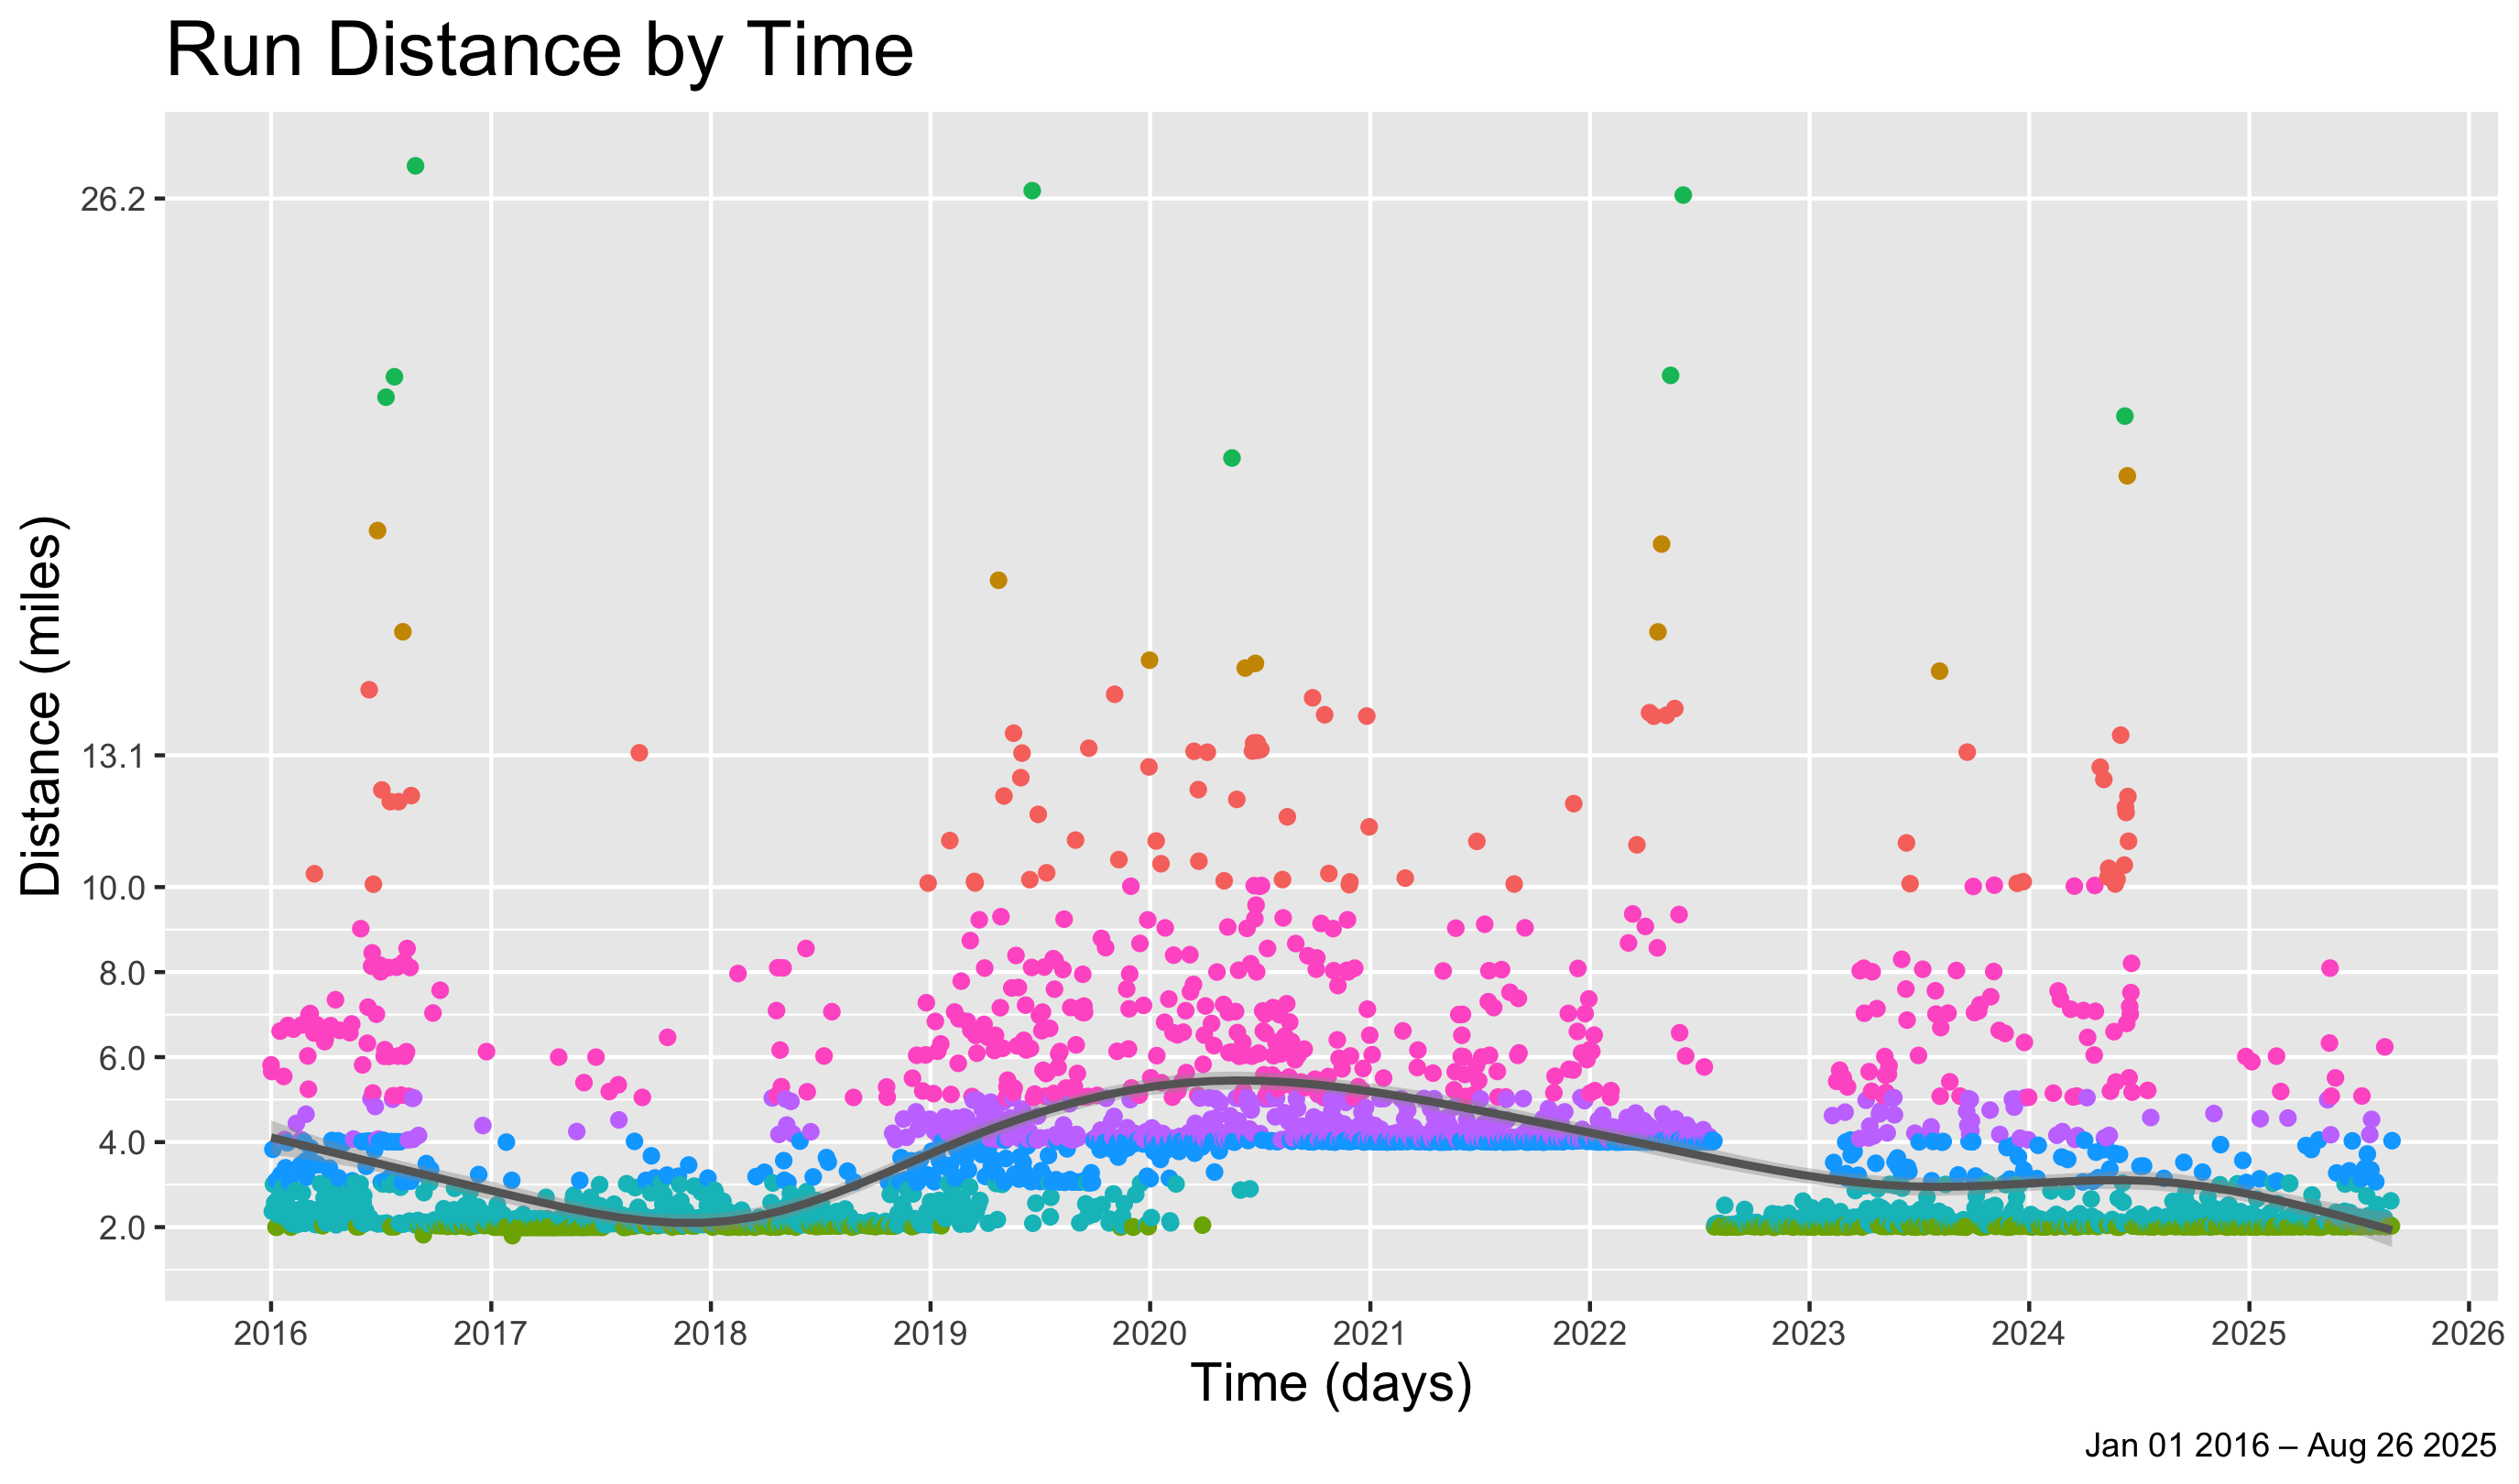
Run Distance
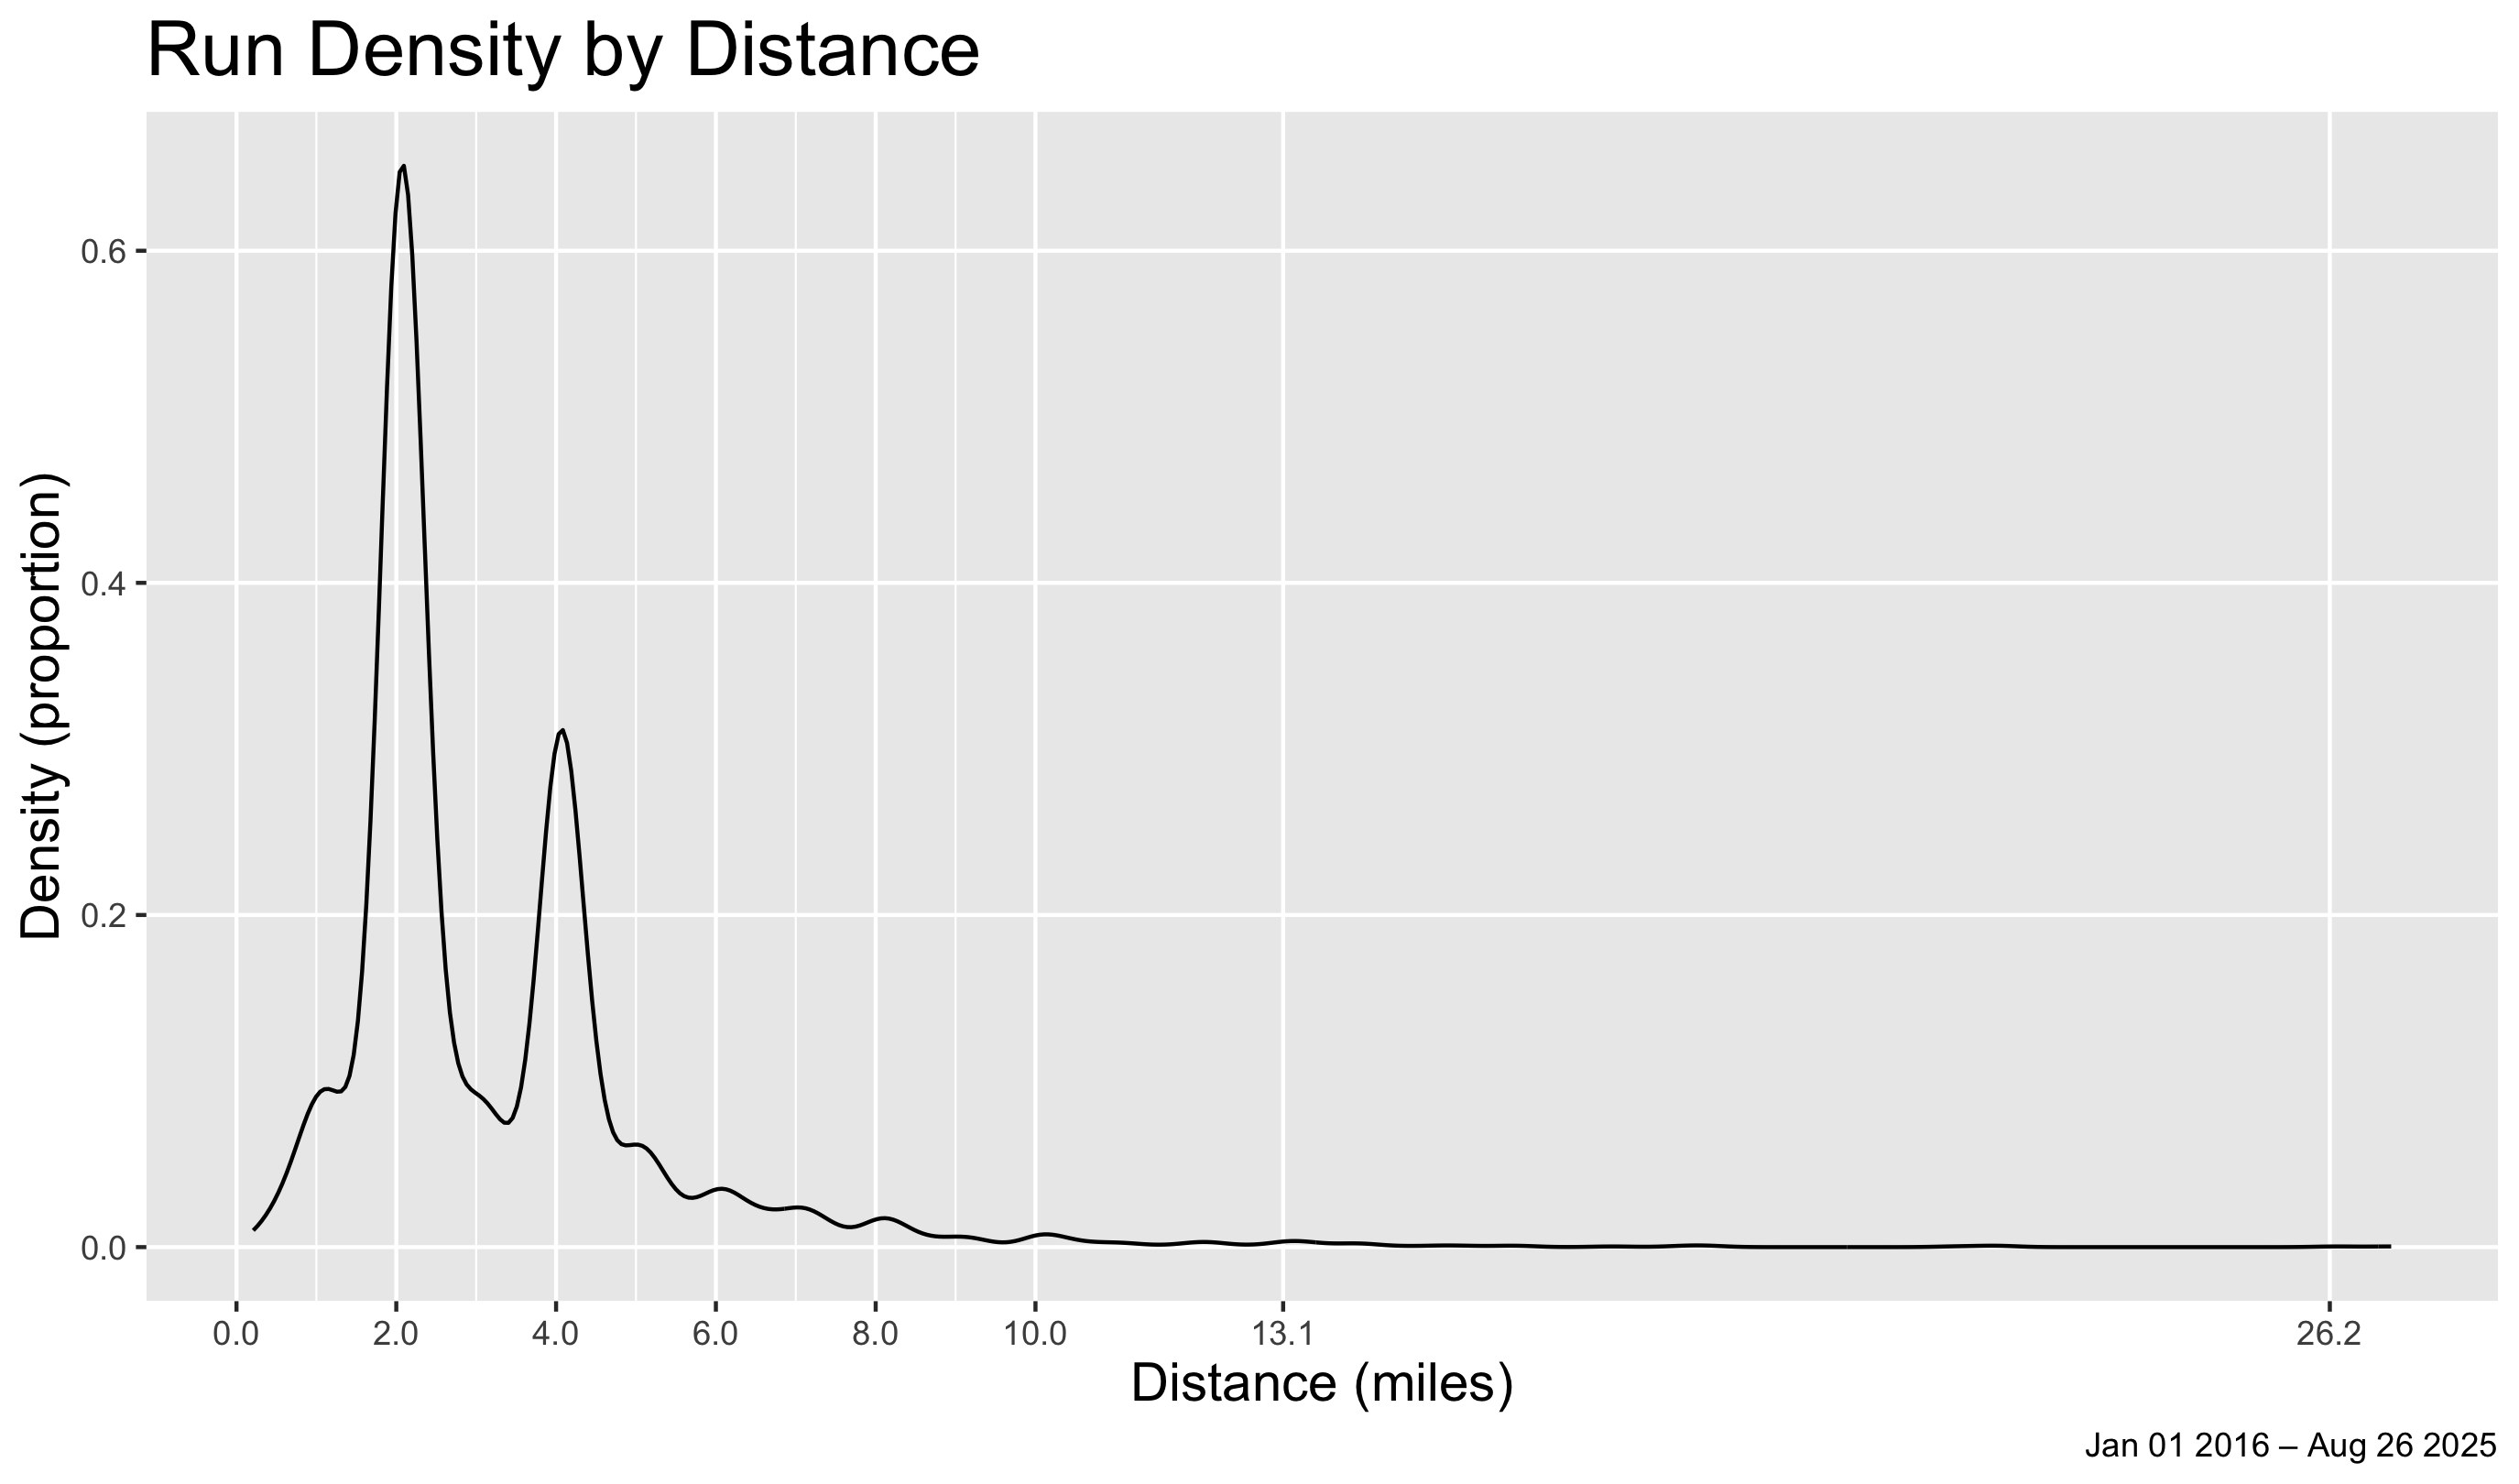
Run Density
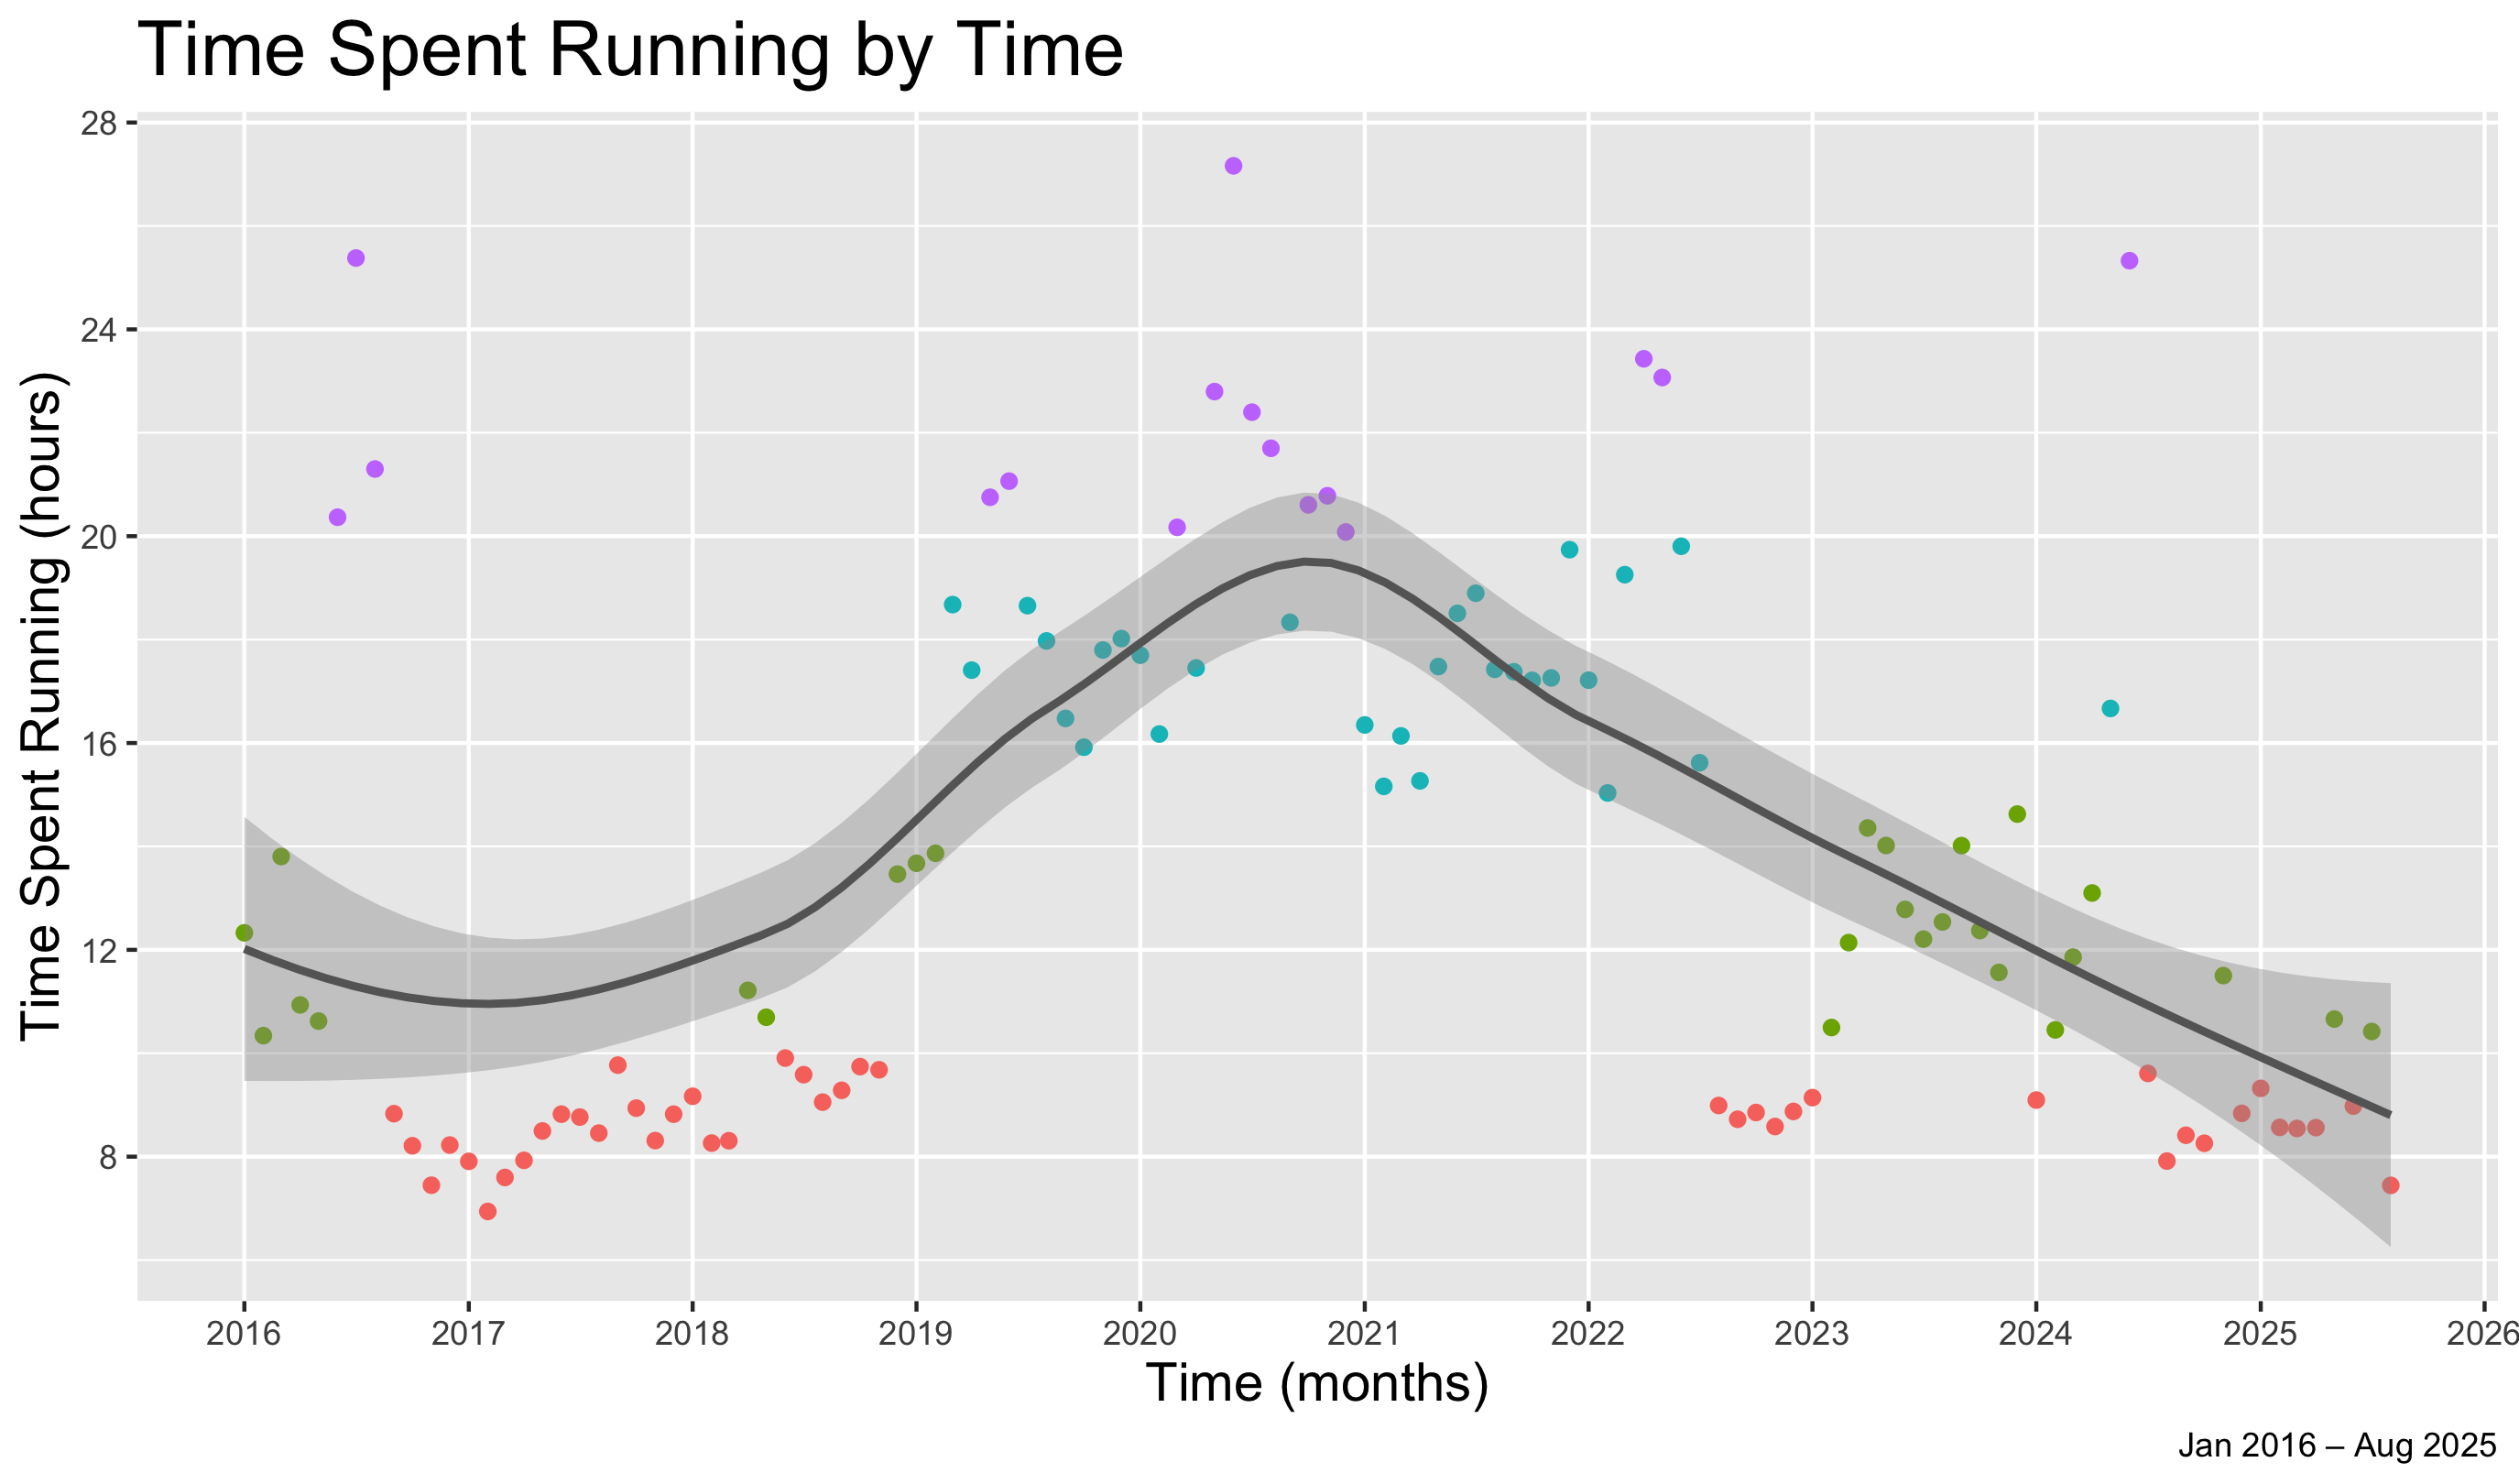
Time Spent Running
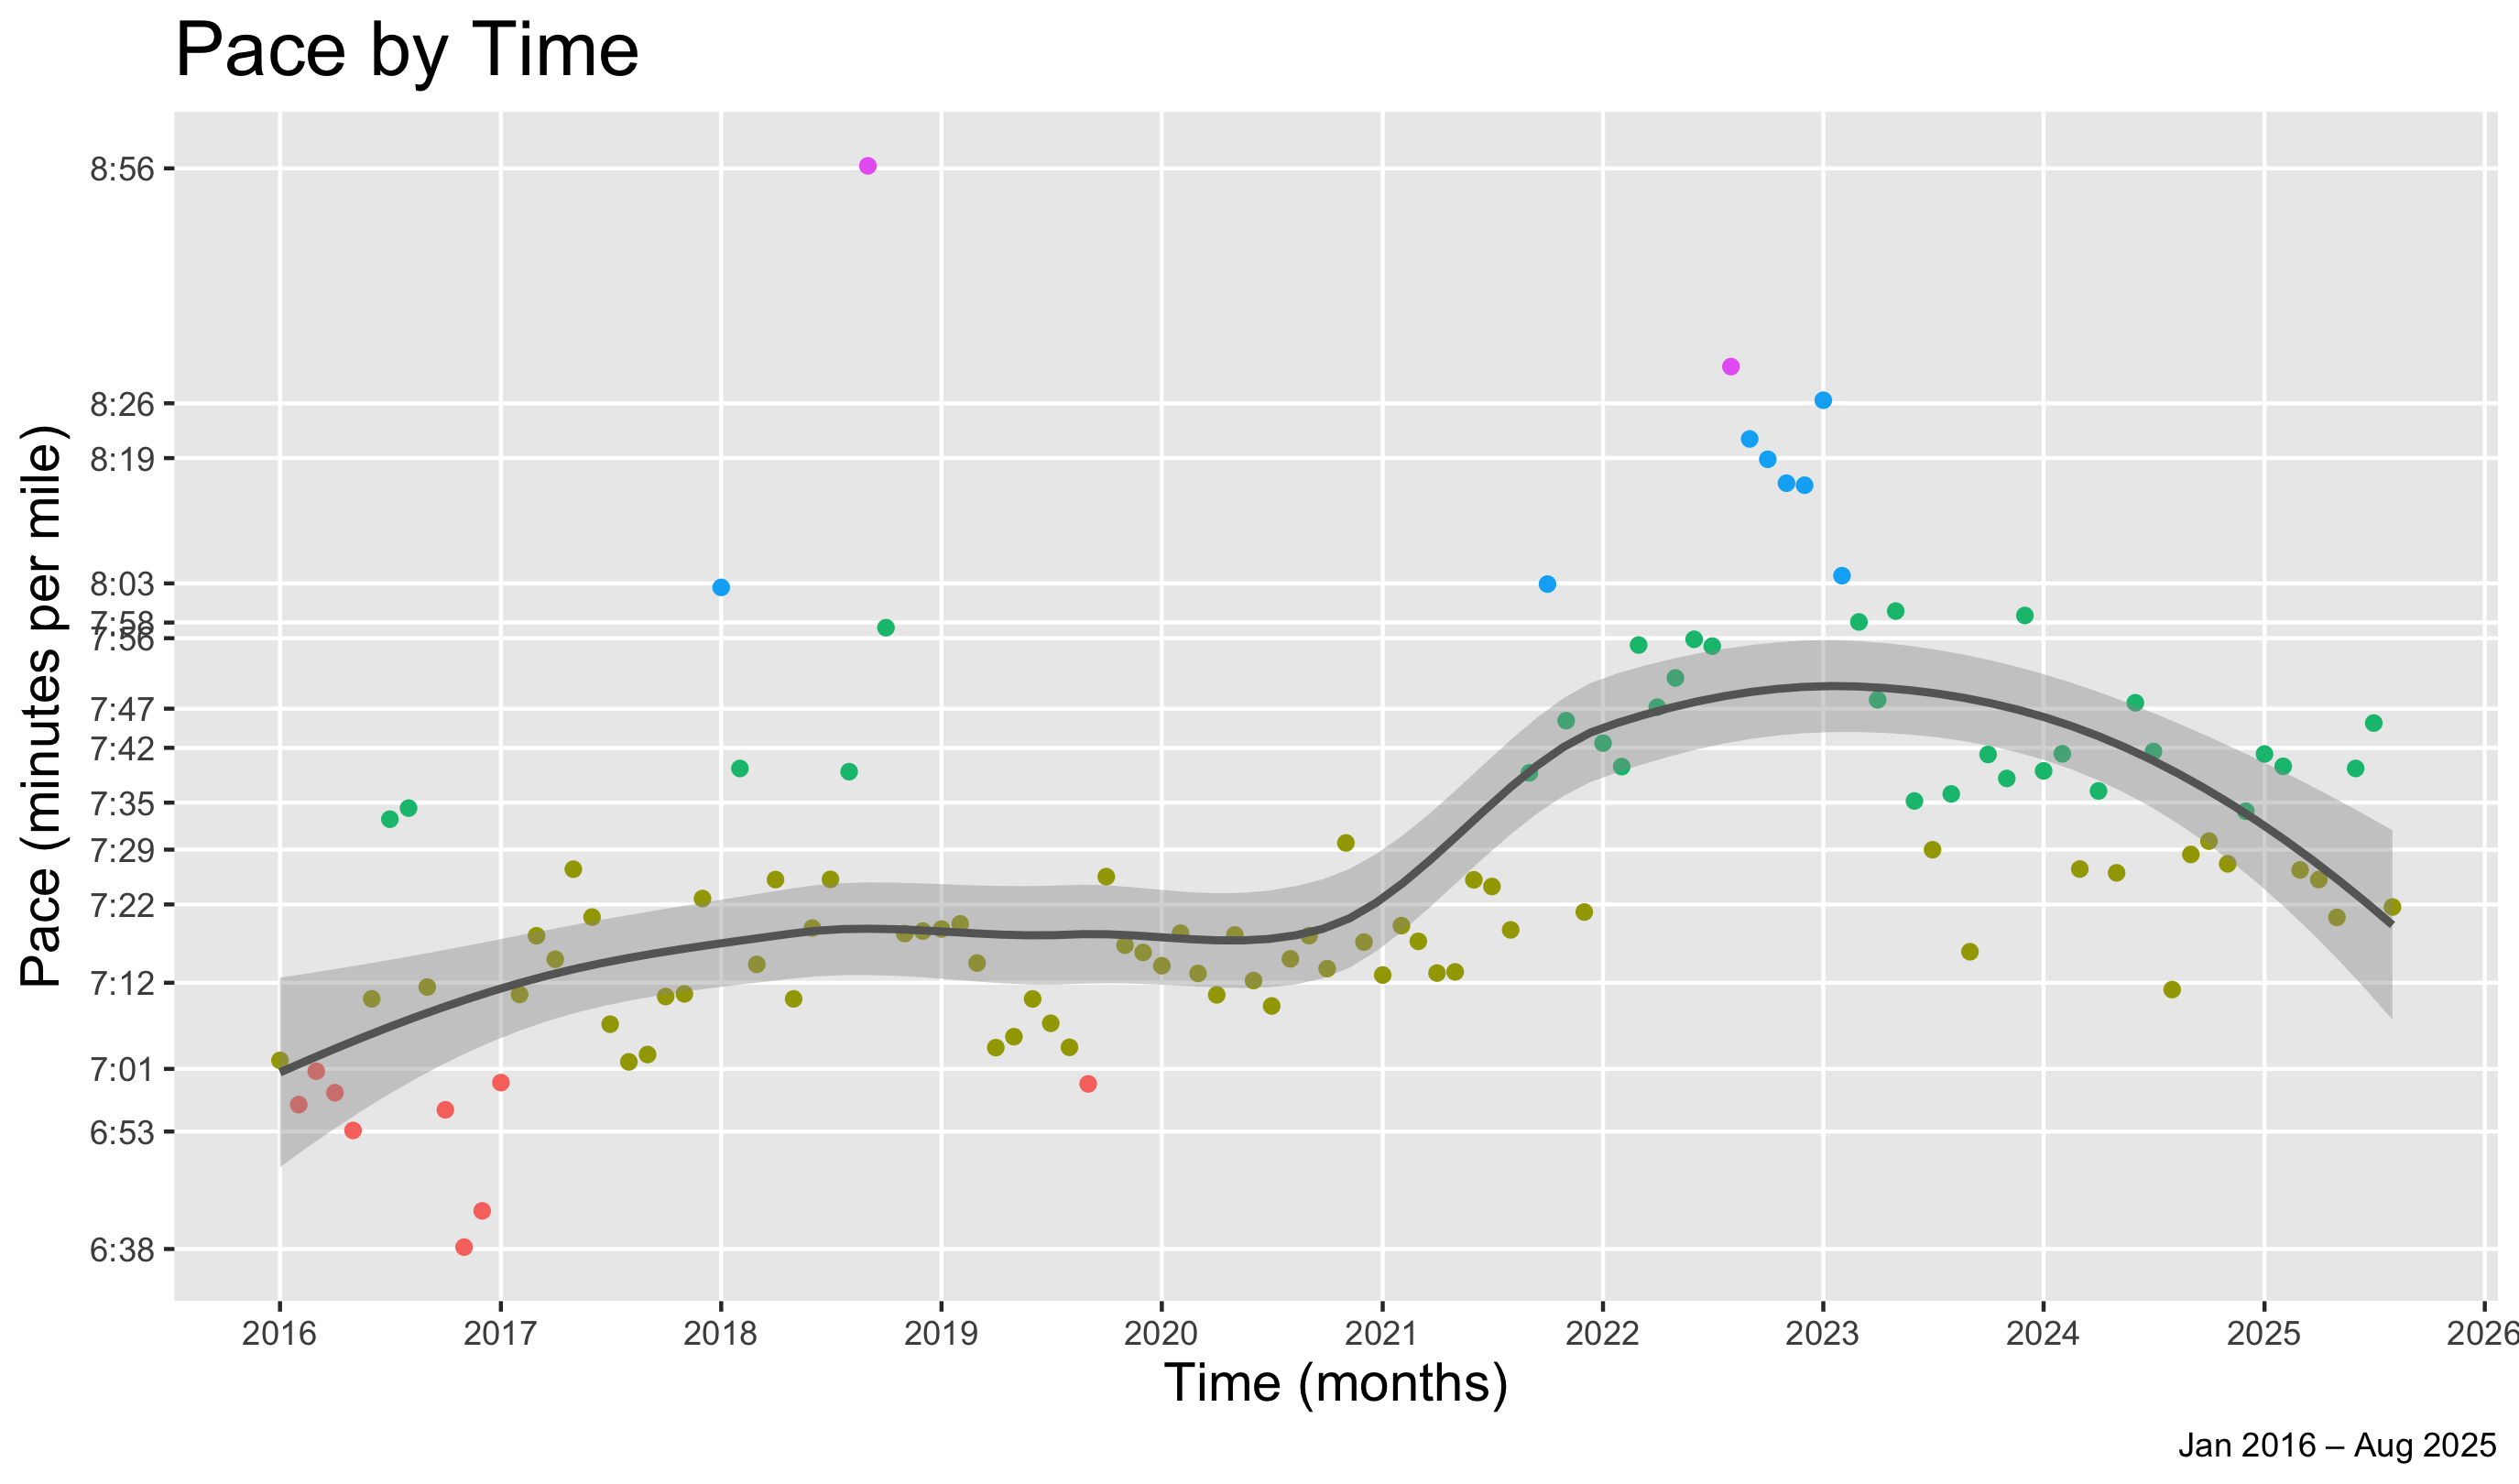
Pace
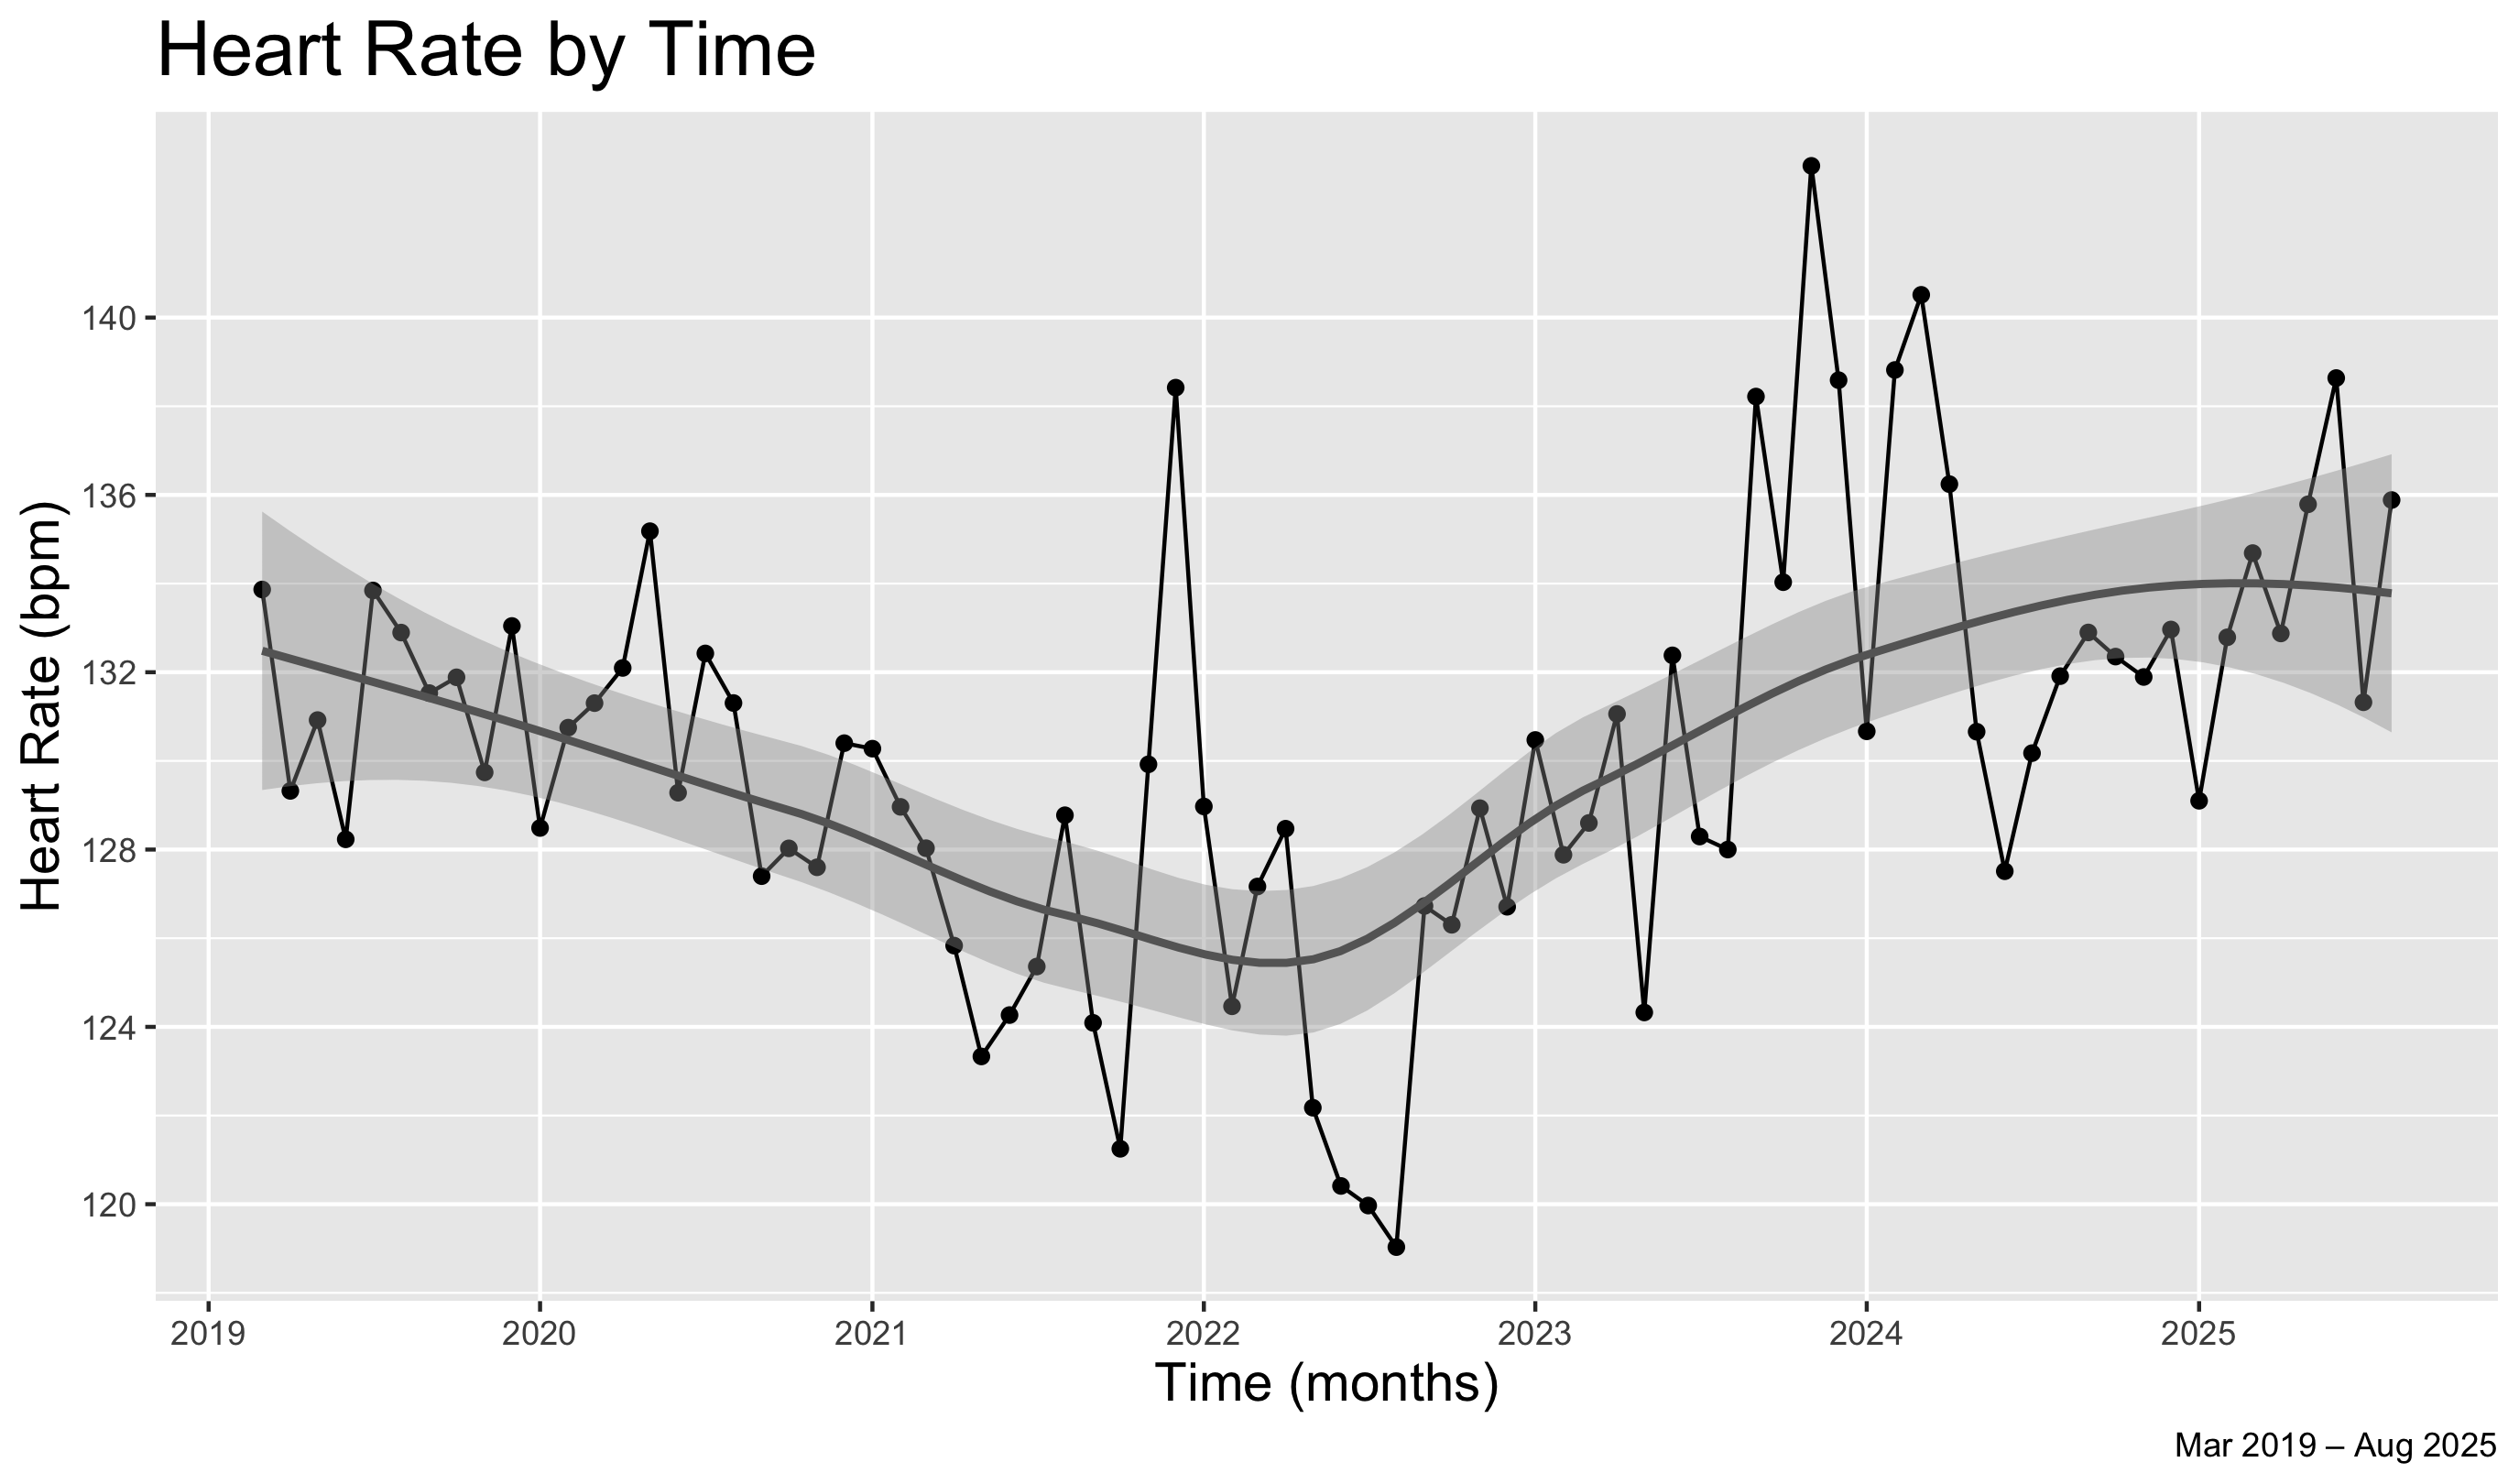
Heart Rate
Needless to say, I get around. :)
Happy running/data-ing!
| Year | Miles |
| 2011 | 55 |
| 2012 | 606 |
| 2013 | 192 |
| 2014 | 229 |
| 2015 | 366 |
| 2016 | 1314 |
| 2017 | 830 |
| 2018 | 930 |
| 2019 | 1759 |
| 2020 | 2020 |
| 2021 | 1652 |
| 2022 | 1326 |
| 2023 | 1157 |
| 2024 | 1085 |
| 2025 | 569 |
| = | 14090 |